


Gantt Diagram (Coming Soon)
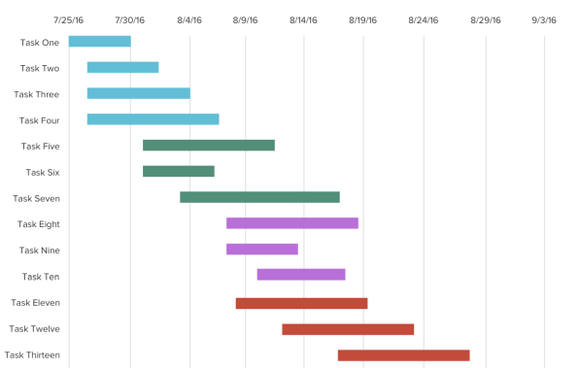
Add Gantt charts to your analytics suite! A Gantt chart is a type of bar chart[1][2] that illustrates a project schedule. This chart lists the tasks to be performed on the vertical axis, and time intervals on the horizontal axis.[1][3] The width of the horizontal bars in the graph show the duration of each activity.[3][4] Gantt charts illustrate the start and finish dates of the terminal elements and summary elements of a project. Terminal elements and summary elements constitute the work breakdown structure of the project. Modern Gantt charts also show the dependency (i.e., precedence network) relationships between activities. Gantt charts can be used to show current schedule status using percent-complete shadings and a vertical "TODAY" line as shown here.